Seeing an aurora in the night sky is a rare event for observers in middle latitudes, which includes the St. Louis region where the River Bend Astronomy Club (RBAC) resides. Nevertheless, members of RBAC have photographed several such events since late October of 2003. The result was our photos making the front page of nearly every newspaper in St. Louis and the Metro East area, as well as some television news reports.
There are numerous tools that can help an observer catch the best time to see an aurora. First and foremost are local news reports. But even these sources missed the initial auroral events of October 2003. Thanks to satellites, ground-based instruments, and the internet it is now possible to monitor certain conditions; however, it typically requires a user to visit a half dozen or more web sites to get all the data you need. RBAC now provides this web site, which contains images and explanations of everything we find useful.
Explanation of Kp:
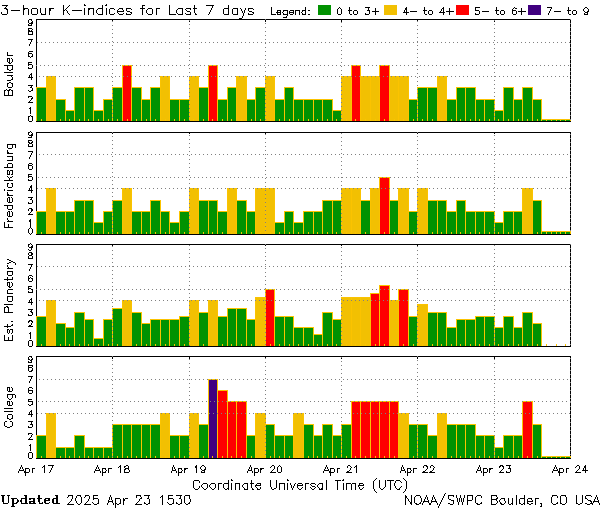
Costello geomagnetic activity index, also known as the Kp index, indicates the level of geomagnetic activity or the severity of solar wind particles interacting with Earth’s magnetic field. A level of 5 or higher is an indication of a “storm”, but this does not necessarily mean that an aurora will be visible in the middle latitude region of our planet. In general, a level of 7 usually enables an aurora to be visible in the St. Louis area.
The graphic below depicts the Kp value using bars, with each bar representing a 3-hour period. It also depicts “storm” level geomagnetic activity as red.
NOAA Aurora Activity Index:The NOAA-15 satellite orbits our planet in a polar orbit, which means it passes over each pole. It requires 101 minutes to make one orbit around our planet. The Space Environment Center (SEC) writes, “Instruments on board the NOAA Polar-orbiting Operational Environmental Satellite (POES) continually monitor the power flux carried by the protons and electrons that produce aurora in the atmosphere.” The graphic below serves two purposes. First, it is a visual representation of the extent of an aurora. Second, there is an activity index along the left side of the image. Both of these can help in determining the visibility of an aurora. With respect to the visual representation, the shape and boundary of the aurora is indicated, as well as the intensity. The more red color in the image, the stronger the aurora. The activity index is the NOAA Aurora Activity index, which is a 10-point scale. In general, when the index is at 10, the possibility of an aurora in the St. Louis region is very good.

Hopefully, this page will be a useful tool. If other factors are identified that help in predicting the visibility of an aurora, they will be added in the future. For right now, if the Kp chart has tall red bars, the Bz chart has a strong southerly value, the NOAA activity index is 10, the last two graphics depict large red areas, and it is dark and clear outside, you might want to go and observe for a while.


